Confocal Microscopy
CONFOCAL MICROSCOPY APPLICATIONS IN THE MATERIALS INDUSTRY: AN INTRODUCTION
M. A. Sala
Advanced Engineering, Corning Incorporated, SP-TD-00, Corning, NY 14831
ABSTRACT. Confocal microscopy has been used almost exclusively for high-resolution 3-D imaging of biological specimens. As a tomographic technique it lends itself to the non-destructive analysis of many material substances including powders, glasses, structures, semiconductors and surfaces. By utilizing multispectral fluorescent techniques a greater range of heretofore-invisible features may now be seen.
Keywords: Microscopy, Confocal, Scanning, Fluorescence, and Imaging
PACS: 87.64.Tt, 87.64.Rr, and 07.79.Fc
INTRODUCTION
Invented by Marvin Minsky in 1957 (patent № 3,013,467) the Confocal microscope has become the premier tool for the biologist allowing 3-D imaging within the cell. By having a tight depth of focus (100’s of nm), an individual plane within a specimen can be visualized (FIGURE 1). These individual planes may then be reconstructed into a 3-Dimensional image that can be manipulated in similar fashion to a Computed Tomography (CT), Magnetic Resonance Imaging (MRI) or Ultrasound Techniques (UT). The light that utilized in wide-field microscopes will “blur” all of the “layers” into an incoherent mess. By utilizing a coherent LASER light and high numerical aperture (na) objectives, a single layer, nanometers thick, may be resolved. It is also common to use a fluorescent tag to image structures at an excitation wavelength and collect at a different emission wavelength.
At Corning Incorporated we use Confocal Microscopy to image a variety of materials and products including IC circuitry, surfaces, internal structures, and to accurately measure the depth of coatings that were only achievable by destructive means. We have also been temporally fooled by artifact caused by refractive index (RI) changes between layers.
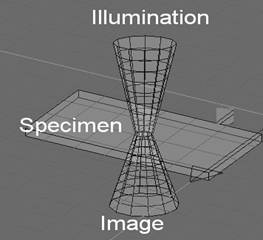
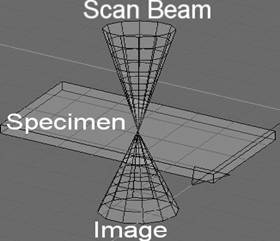
FIGURE 1. Extreme Depth of Focus with Scanning Confocal Microscope not possible with wide field microscopes not illuminated with a coherent source.
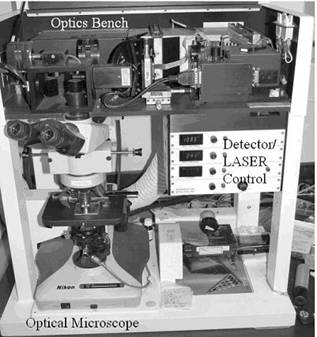
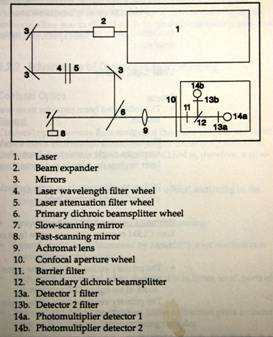
FIGURE 2 Actual Microscope in Corning Incorporated Lab (Sarastro 2000, Molecular Dynamics) [1]
Sample prep is similar to that of any optical microscope save that if one plans to take accurate measurements special attention needs to be paid to the RI of the different materials that the probe beam and image must travel and the appropriate calculations applied.
A computer under software control supplied by the vendor or in the case of true research systems, by the investigator, controls the data acquisition and scanning of a confocal microscope. Images may be presented and saved in a variety of formats with the most popular TIFF. These images may then be ported to 3-D rendering or other analysis software.
THEORY
The main source of magic in the confocal microscope is the use of a pinhole (FIGURE 2) at the detector to eliminate the out-of-focus rays arriving from the specimen.
The light source is a typically an Ar or Ar/Kr LASER with one or more lines available to the investigator. Ar – Ar/Kr is preferred by the biology community because of the number of fluorophores (Cy3 and Cy5, for example) that are excited at these emission lines. (We are planning on modifying our microscope to operate with any external LASER.) The light then passes trough a pinhole on its way to an attenuator, narrow-band filter and the beam-splitter. After the beam-splitter the light is steered in X/Y by a pair of piezoelectric actuated mirrors and paints the beam across the region of interest (ROI) on the specimen. Without these, the LASER would impinge upon one highly in-focus spot returning little useful image data. The early microscopes and some contemporary systems do move the stage in an X/Y pattern. This tends to be slower at acquisition and susceptible to motion artifact when the stage is “bumped.”
After the scanning mirrors, the interrogation beam may pass through more filters or continue through the objective to the specimen. Most Confocal microscopes use a high-quality light microscope as the instrument’s optical foundation with the LASER optics residing on their own optical bench.
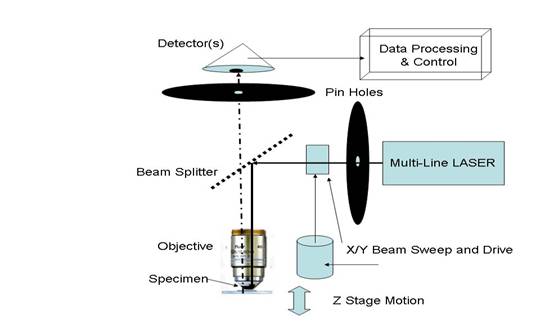
FIGURE 3 Confocal Optical Path showing pinholes and focal planes.
As depicted in FIGURE 3, reflected and/or emission light is then collected by the objective and will traverse the same path to the dichromatic mirror or beam splitter whence it will proceed to the pinhole, more filters, beam-splitters and the detector. When generating a non-emissive image, the detector “sees” the reflected image from the specimen. When utilizing fluorescence imaging, a filter is place in-line to stop the excitation light from being detected.
The X/Y raster painted on the specimen is synchronized with the data arriving at the detector allowing a 2-D image to be captured. This data is then stored in the data-processing hardware. The system’s software often contains routines to enhance the image.
OPERATION and APPLICATION
If it isn’t obvious, the collected image data is viewed on a monitor through processing in a digital computer (in our case, it is an SGI Indigo, not a PC). Was this the only means of viewing the specimen, it would be a difficult hit-or-miss scenario to find the exact point in 3-D space to acquire. So, once the sample is identified and placed on a suitable substrate, such as a microscope slide, the substrate (which need not be transparent as in the case of metals and electronic integrated circuits) is placed on the stage of the optical microscope (in our lab, a NIKON and from here on will refer to this instrument).
The eyepieces are rotated to allow light to pass from the bright-field illuminator through the specimen and into the eyes (about 30° to the right in Fig 2) adjusting the optical microscope is as any other microscope. There is a “fine-focus” knob available to the operator that operates the stage in Z with sub-micron-precision that is controlled by the computer. This number is displayed on the monitor allowing a quick measure of the sample thickness. 4X, 10X, 20X and 40X (oil) objectives are available and selected with regard to the optical magnification desired. The 4X has the smallest numerical aperture and thus the poorest slice definition being used only to get “the big picture” and finding points of interest.
After selection of the objective, the microscope is focused midway between the top and bottom of the specimen and the eyepieces are rotated as in Fig 2 allowing the light to flow to and from the optical bench. The LASER is set to the lowest output energy and the Photomultiplier Tube(s) (PMT) is set to the lowest voltage. Via the operator’s console, the confocal microscope is set to scan continuously in the same plane while adjustments are made to the LASER energy and PMT voltage until a suitable image is presented. To minimize the effects of photo-bleaching to the specimen, the absolute lowest LASER energy should be utilized. This will be an average set point for the instrument with touch-up changes as each slice is collected.
To acquire a 3-D image, the number and thickness of the slices is determined from the minimum feature to be observed and the specimen’s approximate size in Zmm (determined earlier); the greater the number of slices, the better the resultant image will appear. One hundred 500nm slices will take about 30 minutes. These slices are stored as individual TIFF images and can be used later on any appropriate image-processing program.
When making distance measurements the software will take into consideration the optics utilized the number of pixels in an image and the RI. If the beam path traverses oil to specimen and back, (even with a cover slip) measurement can be expected to be reasonably accurate. However if using index-matching oil and there is an air-gap between the objective and the specimen, the measurement will contain an error.
There can be a significant amount of “fussing” required getting an ideal image or measurement; seldom do you get a perfect acquisition on the initial try. For this reason, it is good practice to note all of the set parameters about a particular image or specimen to facilitate making another in the future. An experimental/measurement logbook could be worth its weight in gold when a similar sample presents itself.
An easy measurement was that of Geranium pollen (FIGURE 4) with image acquisition in the manner described above. The ROI kept floating away in the emersion oil so to aid in immobilizing; a cover slip was placed on top. Unfortunately when the objective pressed down on the cover slip, the pollen burst. If the specimen moves at all during the slice acquisition, the image will appear torn. If the sections do not perfectly register, then the 3-D representation will be difficult of obtain.
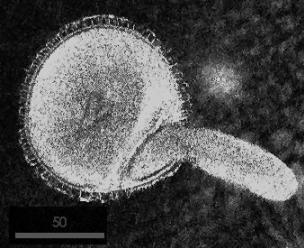
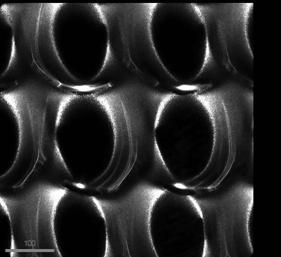
FIGURE 5 shows holes fabricated in a block of glass. At first it appears that the rim is contiguous on the surface, however when visualized with Confocal microscopy, as in
FIGURE 4 Geranium Pollen using a 40X objective, 512 x 512 image, 1mm pixel size, index matching oil, LASER set at 7mW (max 30mW) and PMT at 525VDC (250V to 1,200V range).
FIGURE 6, it is apparent that it is not.
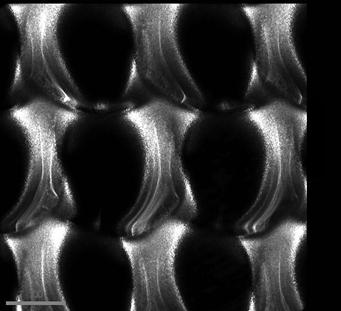
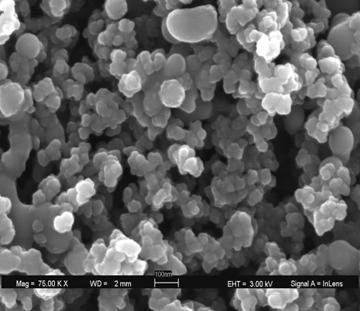
FIGURE 6 the north and south rims are missing at the surface. Other features include potential stress lines on the left and right of each hole or this could be RI aberrations. Glass is a tricky substance to image. FIGURE 7 An SEM of silica nanoparticulates.
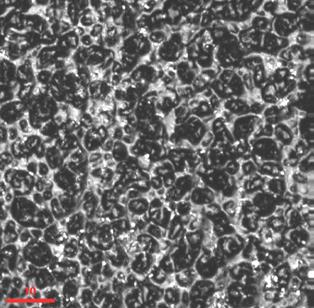
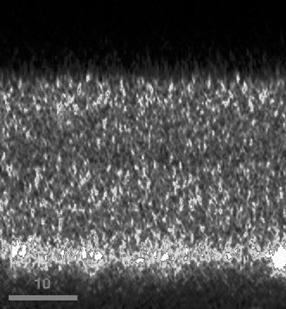
FIGURE 8 same surfaces as SEM via CF. FIGURE 9 A cross section of a silica coating on glass.
A handy feature of the confocal microscope is its ability to generate a single-pixel- width depth profile that will reveal structures in the sagittal plane known as a Vertical Scan. A common means to measure the depth of a coating is to take the coating and its substrate, score / brake and mount on a calibrated optical microscope as in FIGURE 10. FIGURE 9 is a depth profile of FIGURE 8 and reveals structures of which there is no hint from the surface. The depth profile is easy to use; one places a cursor over the 2-D ROI and executes the scan. FIGURE 11 is 50mm wide object in a coating; whether it is a bump or a hole is inconclusive.
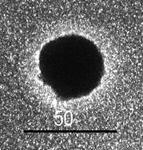

FIGURE 10 demonstrates a commonly used destructive means to measure a coating thickness. FIGURE 11 is an unknown feature.
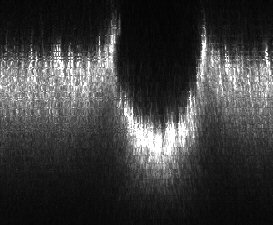
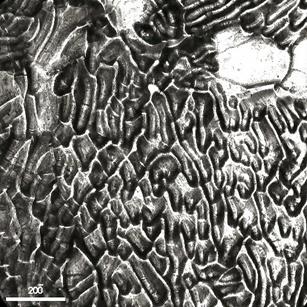 FIGURE 13 Pt erosion.
FIGURE 12 A Vertical scan of the feature in Fig 11 (50mm to 1.5”).
The vertical scan not only reveals the structure as a pit, it also gives its dimensions and that it has a rim.
A final 2-D specimen is Pt that has been eroded by the flow of molten glass as seen in FIGURE 13. Metals are great candidates for confocal microscopy because data is limited to surface features and there is little interference from reflections or refractions.
Three Dimensional (3-D) Image Acquisition
3-D acquisition is accomplished by sequentially moving the focal point of the LASER illumination and image a fixed distance; the thinner the slice the greater the accuracy of the image, up to the limits of the optical system. It is vitally important that the position of the ROI remains stable in 3-D space or the derived 3-D image will be unusable or incorrect.
FIGURE 14 is an example of bad registration of the ROI; the sample began to float in the immersion oil such that it was in a different position for each slice. FIGURE 15 shows the same pollen as intended.
The best software we have discovered for the manipulation of 3-D image data is called VoxelView and runs on an SGI 02. It, unfortunately has limited availability.
CONCLUSION
Confocal Microscopy is not only a valuable tool for the biologist but has significant applications in the engineering and materials fields. Its ability to deliver accurate dimensioning of an ROI, 2 and 3-D images over a wide variety of materials has significant aided in the understanding of process design, failure analysis and documentation at Corning Incorporated.
ACKNOWLEDGEMENTS
This work is made possible by my many internal Corning Incorporated customers, and by my forward-looking and visionary boss Dewey Booth. Special thanks to Rick Rogers of Harvard School of Public Health for all his support with bringing Confocal Microscopy to Corning Incorporated.
REFERENCES
1. Molecular Dynamics Sarastro 2000 User’s Manual, (1992).